
Use the statistics export when you need a summary table rather than the full records. The tables are counts and percentages by category, which is what most grant reports, permit reports, and progress updates ask for. Every table shown on the statistics screen can be written to CSV, TSV, Excel, or JSON.
Statistics are calculated for the active project only.
Opening the statistics screen
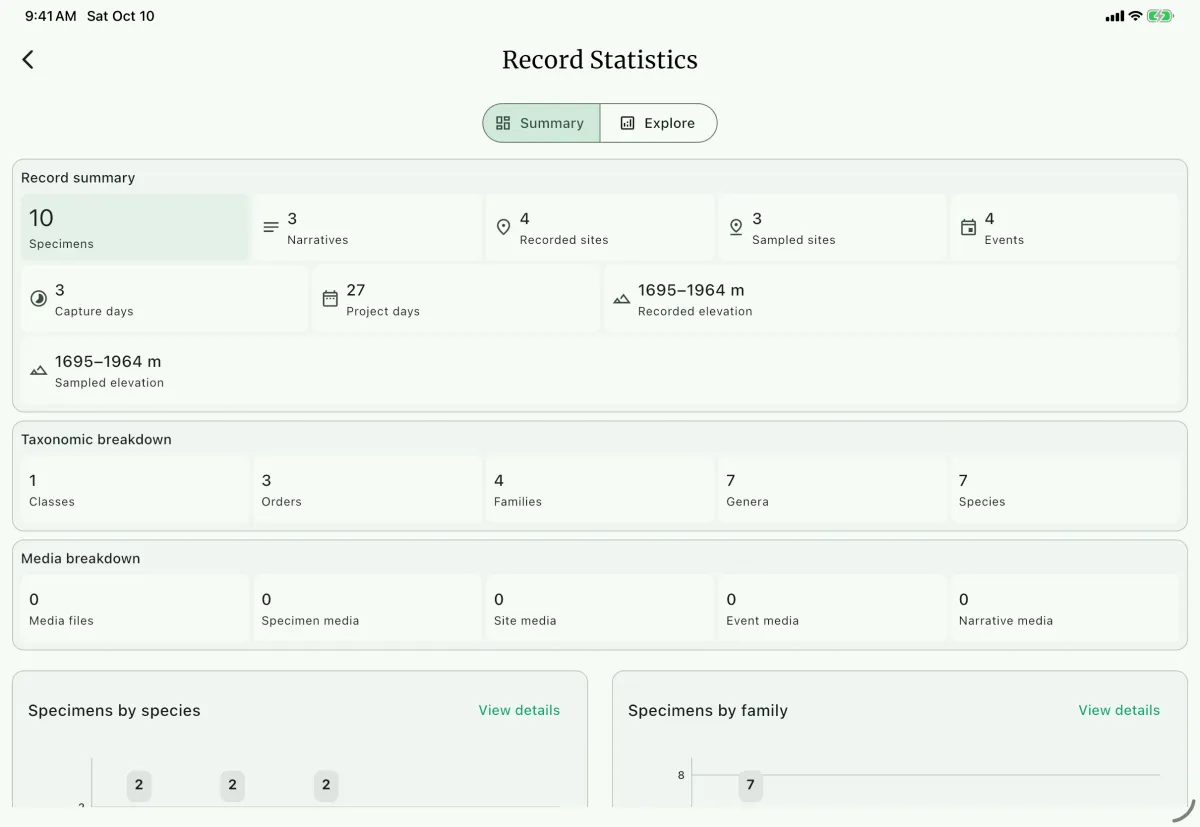
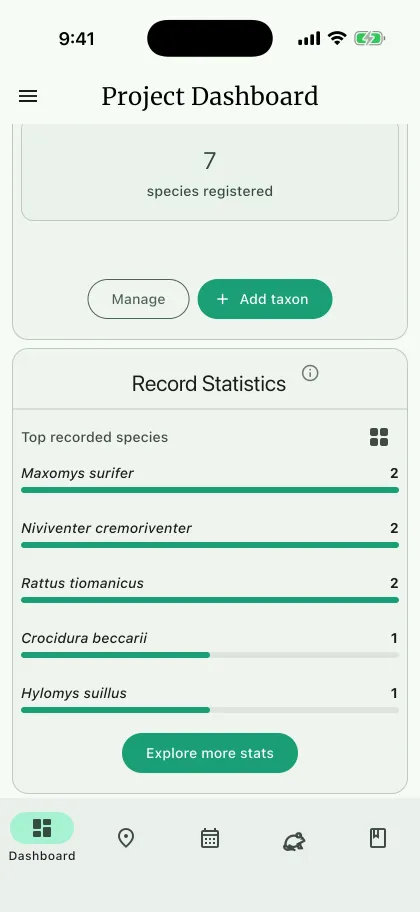
Section titled “Opening the statistics screen”Open the record statistics panel F on the project dashboard and select Explore more stats G. Switch between two views with the buttons at the top of the screen:
- Summary A shows the project totals, split into a
Record summaryC group and aTaxonomic breakdownD group that counts distinct classes, orders, families, genera, and species, followed by the top five counts by category. SelectView detailsE on a chart to open it underExplore. - Explore B offers two choices.
Countsbuilds one table or chart from the measure, grouping, breakdown, and filter you choose.Spatialcounts records by site coordinate, shown on a map or as a table.
Exports are available from the table view. Switch a panel from Chart or Map to Table, then use the Export table button above the table.
Counts
Section titled “Counts”Under Explore, select Counts. Choose a Measure first, because it decides which groupings are available.
| Measure | Group by |
|---|---|
| Specimens | Species, Taxon rank, Site, Date, Method, Sex, Life stage |
| Species | Taxon rank, Site, Date, Method, Sex, Life stage |
| Part quantity | Part type, Treatment |
Life stage only appears when the project records it. Three further controls appear when they apply:
- Taxon rank picks the rank to count by:
Class,Order,Family, orGenus. Species has its own grouping, because it is the only one that offers the breakdown and the site filter below. The chart title, the table header, and the file name all name the rank you picked rather than the grouping, so counting by family readsSpecimens by family. - Breakdown splits specimen counts by species into
SexorLife stage. The breakdown becomes an extra column in the exported table. - Filters narrow the table to one site when counting specimens by species, or to one species when counting part quantity. The selected filter is included in the default file name.
The exported table repeats what the on-screen table shows, one row per category:
| Rank | Species | Specimens | Percent (%) || ---- | ---------------- | --------- | ----------- || 1 | Bunomys coelestis| 24 | 40.00 || 2 | Bunomys penitus | 18 | 30.00 |The second column header follows the grouping you selected, and the count column header follows the measure. With a breakdown active, the series column sits between them, and categories with no recorded value are exported as Not recorded.
Spatial
Section titled “Spatial”Under Explore, select Spatial. The spatial panel counts Specimens, Species, or Family per site coordinate. Coordinates by species asks you to pick a species first and then counts that species at each coordinate.
The spatial table exports one row per coordinate with place name, locality, latitude, longitude, elevation, count, and percent. These counts describe the selected records; they are not measurements of sampling effort. Review missing locations and the selected taxon before using the table in a report or GIS.
Writing the file
Section titled “Writing the file”The export dialog is the same for both panels. On a phone it opens as a bottom sheet, and on a wider screen as a dialog.
Check the file name. NAHPU proposes one built from the project name, the measure and grouping, the active filter, and today's date.
Turn on
Append dateif you want the current date added to the name. This helps when you export the same table repeatedly during a field season.Choose the format.
CSVandTSVare the safest for analysis,Excelwrites an.xlsxworkbook, andJSONkeeps the header names as keys.Select a destination folder. On desktop the file is written where you choose; on mobile NAHPU uses the app export folder.
Select
Export. When the file is written, the button becomesShareso you can send the table straight to another app.
Related pages
Section titled “Related pages”- Record statistics on the dashboard
- Export records for the underlying specimen, site, and event data
- Bundle records for standards-based packages